在 CLion 中使用 Valgrind 和 gdb 调试程序
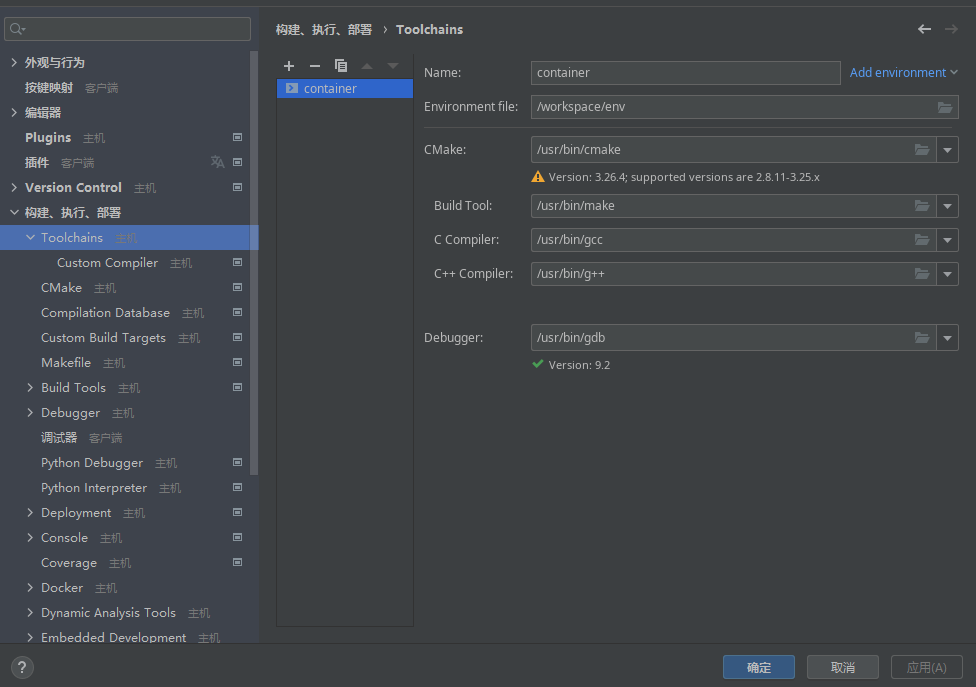
配置编译工具链
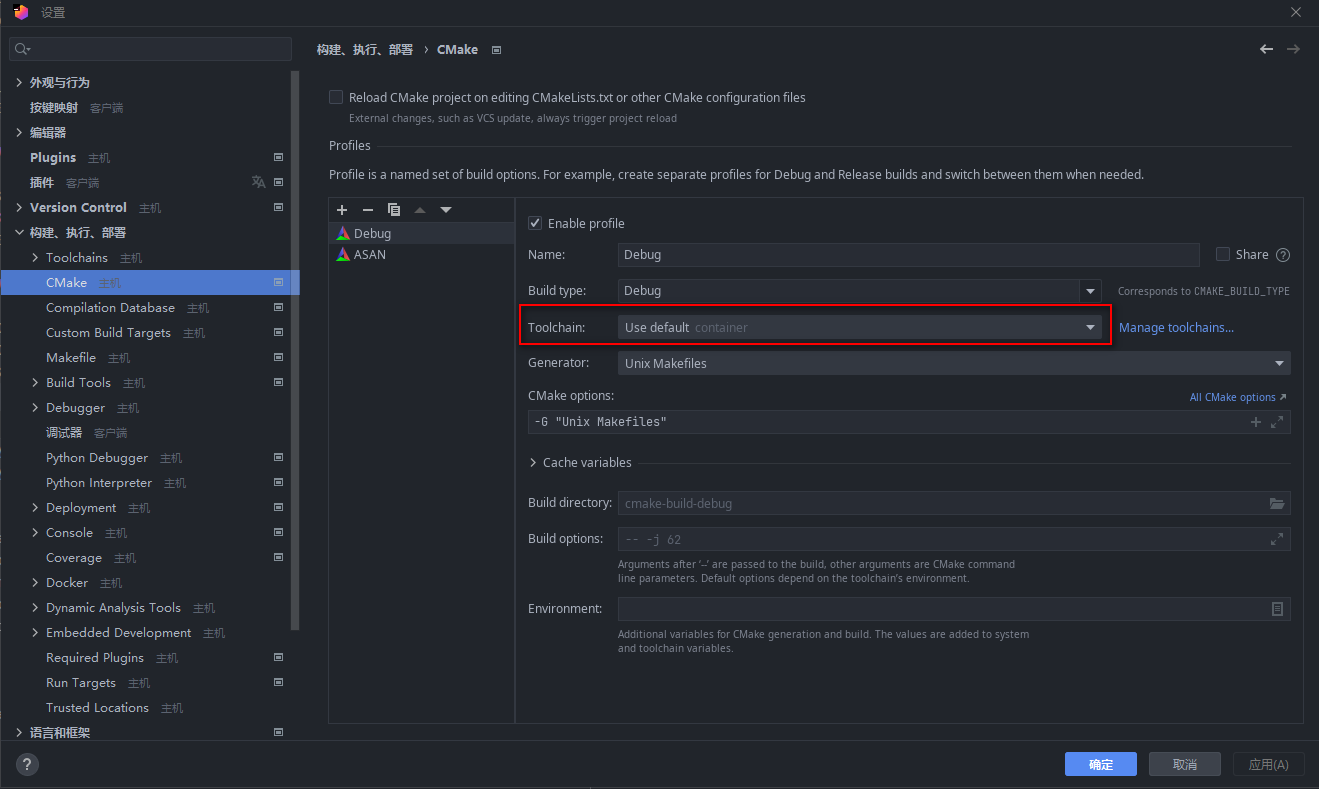
配置 debug 程序
- 安装 gdb
apt-get install gdb
- 配置 CLion
配置 Valgrind[1]
- 安装 valgrind
# apt 安装
apt-get install valgrind

# 源码安装
cd valgrind-3.21.0
./configure
make -j$(nproc)
make install
- 配置 CLion
配置 CLion 以在 vgdb 模式下启动 Valgrind。在vgdb模式下,Valgrind将启动一个gdbserver在Valgrind下调试我们的程序。
打开 CLion 设置并导航到 Build、Execution、Deployment > Dynamic Analysis tools > Valgrind。将以下选项附加到现有的分析选项:
--vgdb=yes --vgdb-error=0
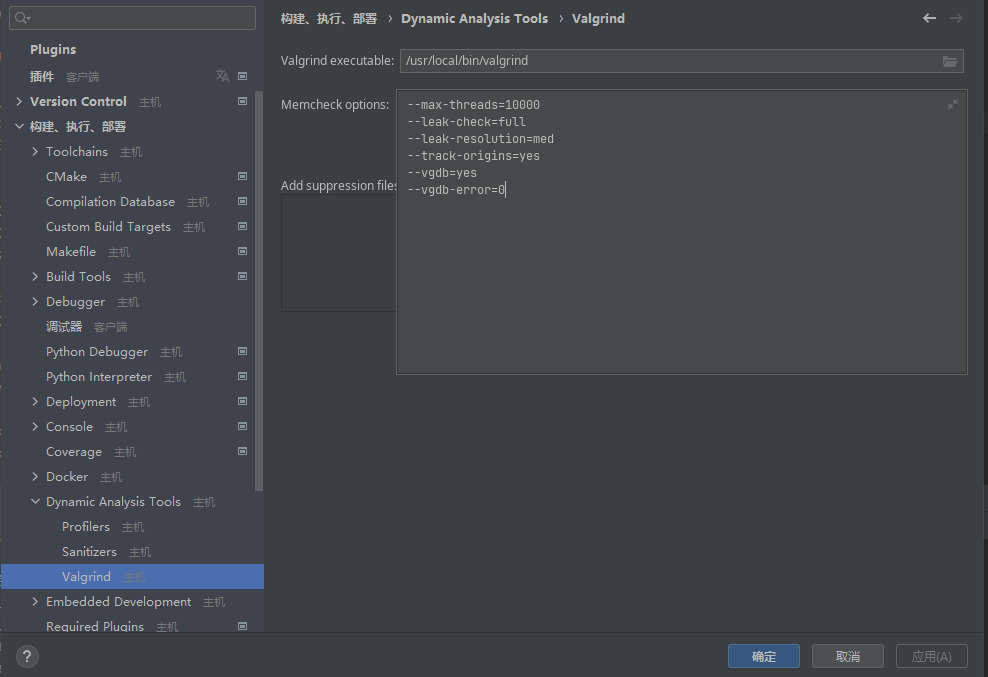
--vgdb=yes 启用 Valgrind gdbserver。--vgdb-error=0 告诉 Valgrind 暂停调试会话,以便我们有时间启动远程 gdb 会话,如下所述。
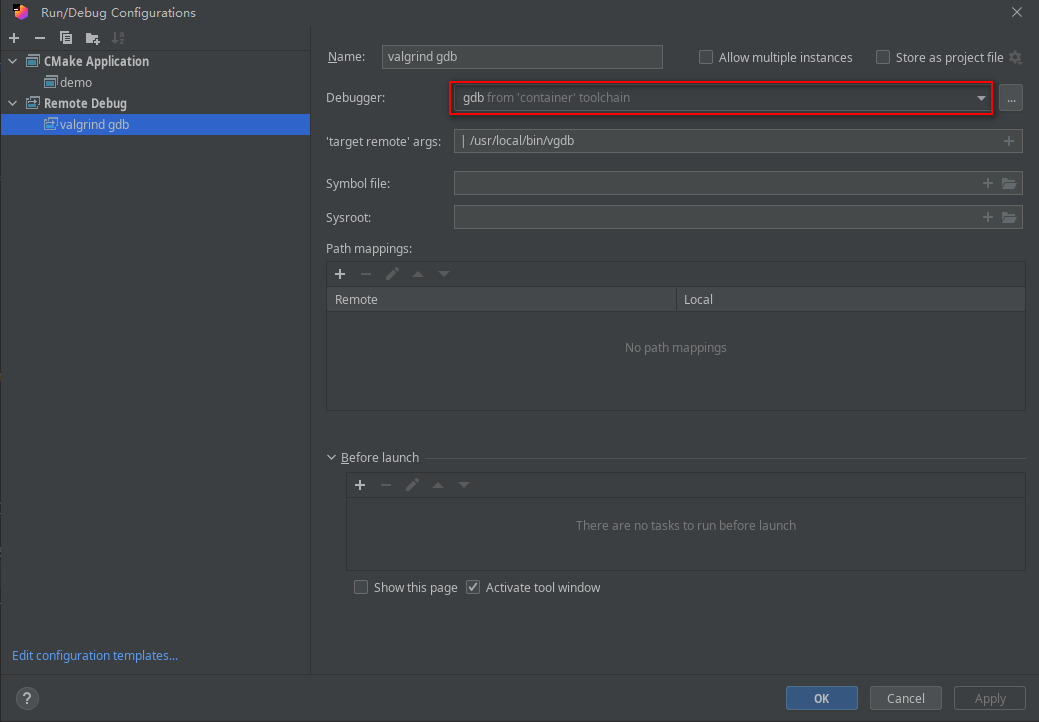
创建 CLion 配置来调试 Valgrind gdbserver[3]
创建一个 CLion 调试配置来连接到 Valgrind 将创建的 gdbserver。
-
Run > Edit Configurations
-
创建新的 Remote Debug 配置。
-
将配置命名为Valgrind gdb
-
在 ‘target remote’ args 字段中写入
| /usr/bin/vgdb. 管道字符很重要[2][4]。
在 Valgrind 下调试程序
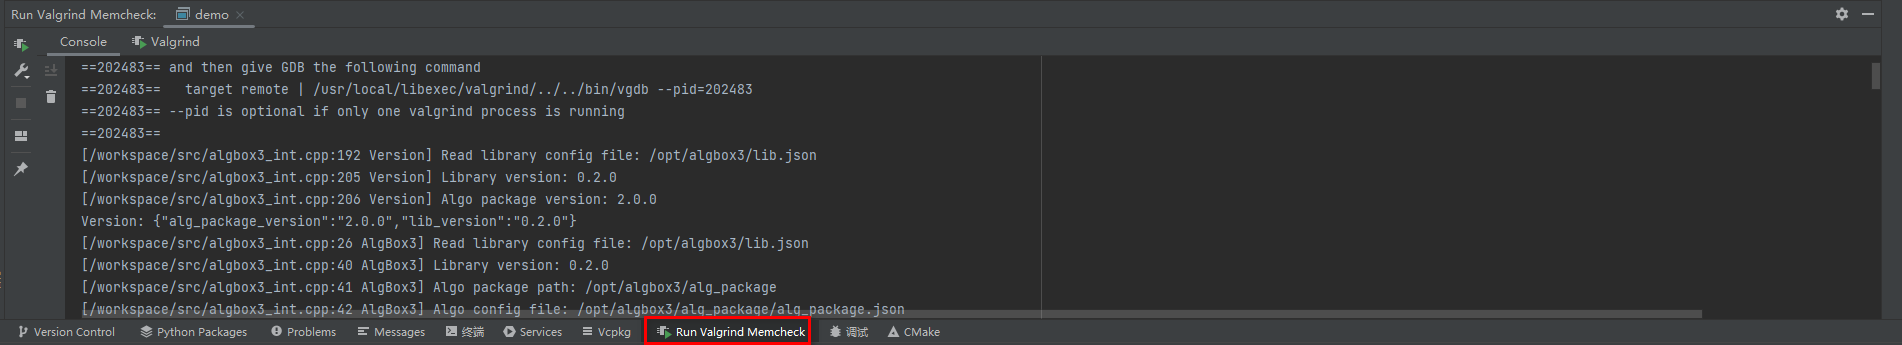
- 选择要调试的程序的配置并使用 Valgrind memcheck 运行它。

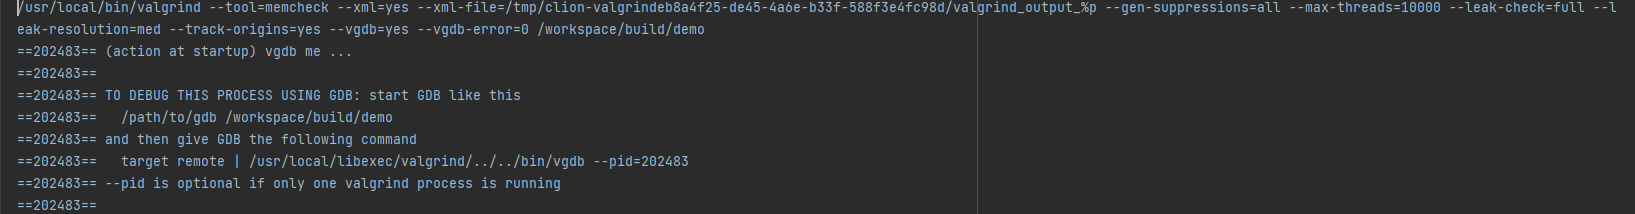
Valgrind 在启动程序之前等待 gdb 调试器连接。
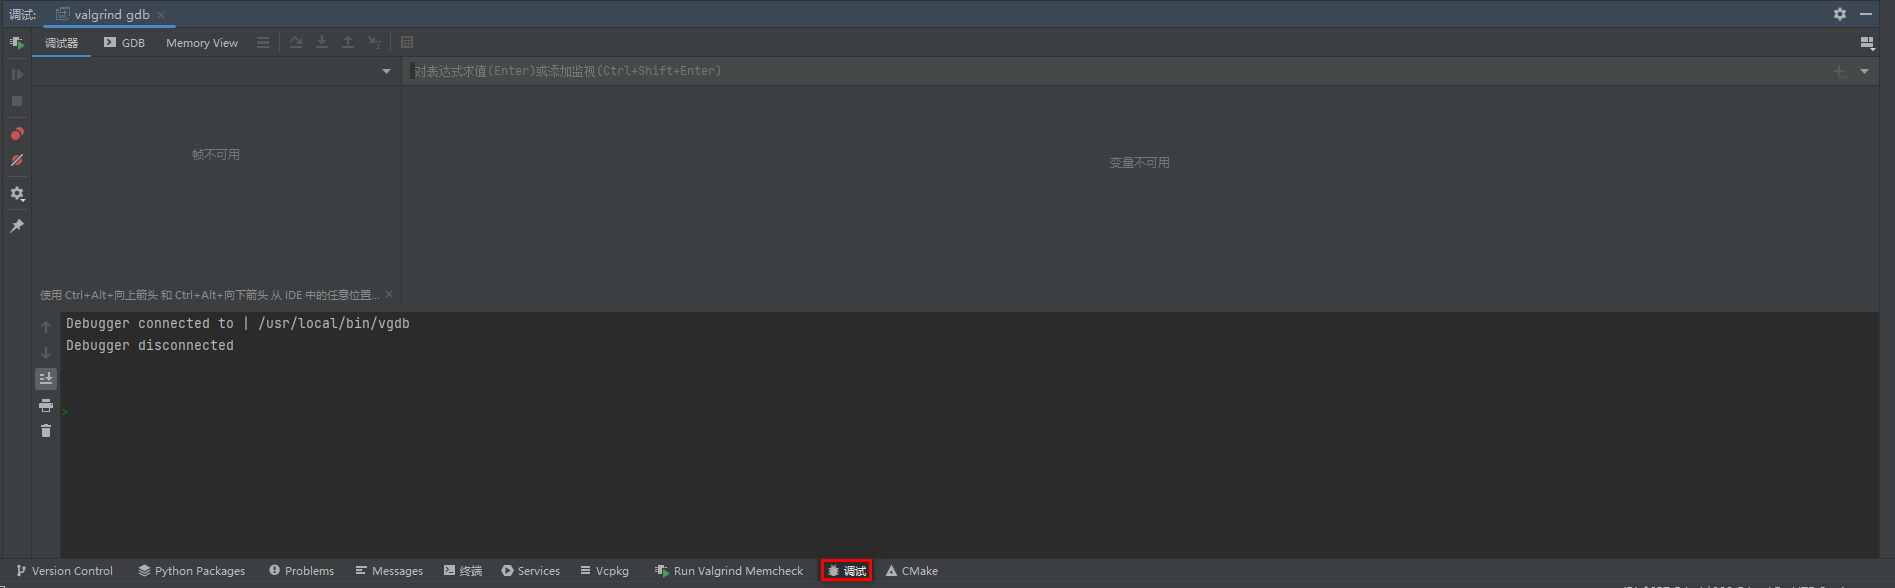
- 在不停止 valgrind 进程的情况下,选择您创建的 Remote Debug 并在调试模式下运行它。

现在 Valgrind 将检测到调试器已连接,并将启动您的程序。在运行选项卡上,您可以看到正在分析的程序的输出。程序停止后,您将在那里看到 Valgrind 报告。
在调试选项卡上,您可以使用常用的调试控件。
当 Valgrind 检测到问题时,它会发出陷阱信号 (SIGTRAP)。然后,您可以检查堆栈跟踪以及常用的调试命令。您还可以通过 CLion 的 gdb 控制台向 Valgrind 发送命令来释放 Valgrind 的强大功能。
说明
CLion 不会显示发送到 Valgrind 的 gdbserver 的监视器命令的输出。
https://youtrack.jetbrains.com/issue/IDEA-256947
故障排除
定期 Valgrind 分析
如果您想在不使用调试器的情况下运行常规 Valgrind 分析,则需要再次编辑 CLion Valgrind 配置并将 vgdb 选项设置回no : –vgdb=no。
远程通讯错误
使用 GDB 远程调试配置进行调试时,您可能会遇到以下错误:
com.jetbrains.cidr.execution.debugger.backend.gdb.GDBDriver$GDBCommandException: Remote communication error.  Target disconnected.: Connection reset by peer.
Debugger disconnected
通常问题是有多个 Valgrind 实例正在运行,而 CLion 不知道应该连接到哪一个。
最简单的解决方案是停止所有 CLion 进程,使用操作系统任务管理器终止任何正在运行的 Valgrind 实例,然后重试。在 x64 Linux 计算机上,该进程将被命名为memcheck-amd64-。
如果您确实需要同时运行多个 Valgrind 实例,您可以通过编辑 GDB 远程调试配置并将 pid 添加到“目标远程”args 命令来指示 CLion 连接到特定实例,如下所示:
| /usr/bin/vgdb --pid=63077
请注意,每次都需要编辑配置并更改 pid 号。当以 vgdb 模式启动时,Valgrind 在控制台上打印 pid。
参考
- CLion Valgrind memcheck (jetbrains.com)
- Debugging your program using Valgrind gdbserver and GDB (valgrind.org)
- CLion GDB Remote Debug (jetbrains.com)
- Connecting to a Remote Target (sourceware.org/gdb)
- Debugging your program using Valgrind and CLion on Linux (ferranpujolcamins.cat)